Trade Tops and Bottoms
Original price was: $299.00.$14.00Current price is: $14.00.
- Affordable & Permanent Stored Courses
- No hidden charges
- We care about your privacy
- Instant MEGA links Download
- 100% Safe and Secure Payments
- Description
- Size Guide
- Reviews (0)
Description
Trade Tops and Bottoms
Trade Tops and Bottoms . Professional Traders Know When a Market Has Bottomed and Topped

Traders need a dependable way to know that a top or bottom is in place. They need a method that:
– Is trustworthy and reliable
– Has high odds for producing solid results
– Is consistent
– Gets you into the trade near the top and near the bottom
– Has clear, close-in stops
– Doesn’t require an indicator, expensive software or fancy calculations to trigger signals
– Produces almost immediate results
– Works on all time frames and in all freely traded markets
– Is easily seen and assessed by the trader
Our Unique Offer on Tops & Bottoms
Our Tops & Bottoms tutorial is unique as we explain in clear terms what you need to see in your chart to reliably assess that a top or bottom is in. This includes the overall background conditions and how structure must appear. We tell you clearly when the top or bottom doesn’t form properly and exactly what to look for. No one else does this.
You aren’t just given a few examples. There is over two hours of detailed review with numerous charts where we explain in detail all the key elements of market tops and market bottoms, including:
– A conceptual model of tops and bottoms so you can understand the specific market action you are looking for
– Specific Entry techniques for tops and bottoms
– Understanding protracted tops and the characteristics of secondary distribution
– Reading the chart for accumulation and what it looks like-this alone will keep you from holding onto short trades or going short at the wrong time
– Likely areas a market will turn
– How to read tops and bottoms bar-by-bar using only price and volume
– How to use the Weis Wave for incredibly accurate confirmations of tops and bottoms
– Using multiple time frames to increase the odds of identifying high quality trades
– Key indications that a market has turned
– Specific trade setups for trading tops and bottoms, along with the all-important background conditions that must be in place
– Identifying the “Springboard”-i.e., the very specific point in the top or bottom where the market is poised to move off the highs or lows rapidly.
– And much more .
TopBottom 4
After four days of downside momentum, SPY was ready to rally intraday. Traders with the knowledge, skills and abilities to understand when a bottom was likely took long positions with close stops right at the bottom on the multiday pullback. This is a 10-minute chart of SPY, the ETF for the S&P 500. The same setup occurred on ES, the S&P futures.
Learn to Trade Tops & Bottoms with Confidence
If you really want to be able to read market tops and bottoms and see the way professional and other successful traders trade them, then we invite you to consider the Tops & Bottoms webinar recording.
-
- Please leave your email address for further Updates from Cultcourse
- Files will be delivered through MEGA Download Link
- Permanent Stored Courses
- 100% Safe & Secure Payments
join us on Telegram : http://t.me/cultcourseJoin us on Instagram : https://www.instagram.com/cultcourse/more courses like this : http://cultcourse.com/shop/
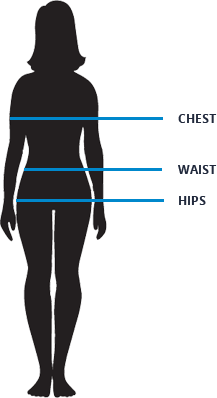
| size | chest(in.) | waist(in.) | hips(in.) |
|---|---|---|---|
| XS | 34-36 | 27-29 | 34.5-36.5 |
| S | 36-38 | 29-31 | 36.5-38.5 |
| M | 38-40 | 31-33 | 38.5-40.5 |
| L | 40-42 | 33-36 | 40.5-43.5 |
| XL | 42-45 | 36-40 | 43.5-47.5 |
| XXL | 45-48 | 40-44 | 47.5-51.5 |









Reviews
There are no reviews yet.